The PE ratio, or Price-to-Earnings ratio, is one of the most important and simple valuation tools in the stock market. It helps investors understand whether a stock looks expensive, cheap, or fairly valued based on its earnings.
In simple words, PE ratio tells us how much investors are paying for one rupee of a company’s profit. This makes it very useful for stock analysis, especially when comparing companies in the same sector.
What Is PE Ratio?
PE ratio is calculated by dividing the share price by earnings per share.
If a company’s PE ratio is high, it usually means the market expects strong future growth. If the PE ratio is low, it may mean the stock is undervalued, or it may mean the business is slow-growing or risky.
That is why PE ratio should never be used alone. It becomes more useful when compared with sector average PE and historical valuation.
Why PE Ratio Matters
PE ratio is important because it gives a quick idea of market expectations.
It helps investors:
- Compare one stock with another.
- Understand whether a stock is expensive or cheap.
- Study sector valuation.
- Find better entry points in strong companies.
For example, a bank stock and an IT stock cannot be judged by the same PE level because both sectors work differently. This is why sector wise PE is more useful than market PE alone.
Indian Market PE Snapshot
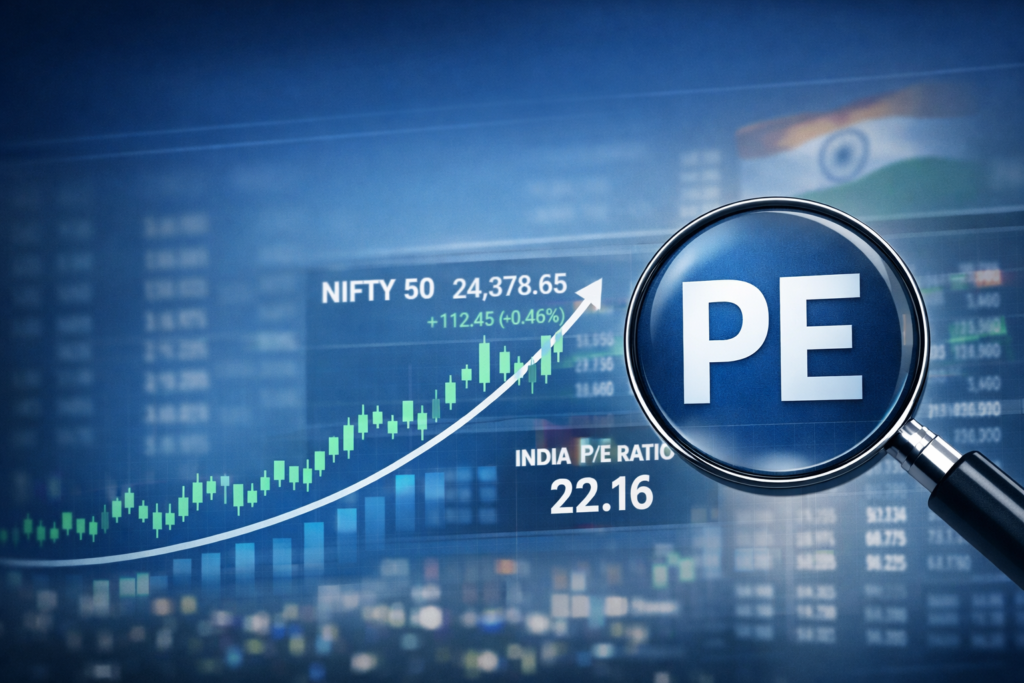
The overall India stock market PE ratio is currently around 22.16, and the 5-year average is around 23.07. This shows that the Indian market is near its normal valuation range.
But for stock picking, sector PE is much more useful than the overall market PE. A stock can look expensive in one sector and still be reasonable in another sector.
Sector Wise PE in India
Every sector has a different business model, growth rate, and risk level. Because of that, PE ratios vary a lot from one sector to another.
Here is a simple sector wise PE view for Indian investors:
| Sector | Typical PE Range | Meaning |
|---|---|---|
| IT / Software | 25–35 | Higher growth and strong earnings visibility |
| FMCG | 25–35 | Stable demand and strong brands |
| Banking / Financial Services | 12–20 | Moderate growth and regulated business |
| Auto | Varies widely | Cyclical business, depends on demand |
| Metals | Single-digit to 20+ | Highly cyclical and commodity-driven |
| Energy / Oil & Gas | Single-digit to 20+ | Depends on global prices and business cycle |
| Realty | Single-digit to 20+ | Sensitive to interest rates and demand |
| Cement | Varies widely | Depends on demand, pricing power, and cycle |
| Telecom | Often high | Capital-heavy business with long-term growth play |
| Pharma / Healthcare | 20–35 | Depends on product pipeline and margins |
These are broad ranges, not fixed rules. PE changes with market conditions, earnings growth, and investor sentiment.
Current PE Ratio Sector Wise in India
Recent Indian sector data shows that PE levels can vary sharply across industries. For example, some sectors may trade at moderate PE, while others may trade at very high PE because of growth expectations or special market conditions.
This is why investors should always check:
- Sector average PE.
- Company’s own historical PE.
- Earnings growth trend.
- Business quality.
A stock with high PE is not always bad. A stock with low PE is not always cheap. The real question is whether the PE is justified by future growth.
How to Use PE Ratio the Right Way
The best way to use PE ratio is to compare a stock with its own sector average.
Here is a simple method:
- Check the stock PE.
- Compare it with sector average PE.
- Check earnings growth.
- Compare with historical PE.
- Decide whether the stock looks reasonably priced.
If a company is trading below its sector PE and has strong earnings growth, it may deserve closer study. If a company has very high PE but weak growth, it may be overvalued.
Best Use of PE Ratio
In my view, the most useful use of PE ratio is sector based comparison.
This works better than comparing every stock with the whole market. A good bank stock should be compared with other banks, not with IT or FMCG companies.
This method helps investors:
- Avoid wrong comparisons.
- Understand valuation better.
- Find good stocks in the right sector.
- Improve stock selection quality.
Limitations of PE Ratio
PE ratio is useful, but it has limits.
It may not work well when:
- Earnings are irregular.
- A company has one-time profit or loss.
- A business is in a turnaround phase.
- A cyclical sector is at peak or bottom.
So, PE ratio should be used as a starting point, not as the only decision-making tool.
Final Thoughts
PE ratio is one of the easiest and most powerful ways to understand stock valuation. For Indian investors, the real strength of PE comes from sector wise comparison.
The Indian market PE is currently around fair value, but the real opportunity lies in finding stocks whose PE is reasonable compared to their sector and growth potential.
If you want to use PE properly, remember this simple rule: compare stock PE with sector PE, not with emotion.
FAQ
What is PE ratio in stock market?
PE ratio shows how much investors are paying for one rupee of company earnings.
What is a good PE ratio?
A good PE ratio depends on the sector. There is no single number for all stocks.
Why sector wise PE is important?
Because every sector has different growth, risk, and business cycles.
Can low PE stock be a good buy?
Yes, but only if earnings quality and business strength are also good.
Is high PE always bad?
No. High PE can be justified if the company has strong growth and future earnings potential.